

Features
Learn about key features in the E5 Trading technical analysis indicator suite for TradingView!
The indicator suite is comprised of four [4] TradingView indicators that work seamlessly together:
[E5 Trading] Setups & Trends | [E5 Trading] Squeezes & Breakouts | [E5 Trading] Advanced RSI | [E5 Trading] Relative Volume
Once you subscribe, access to these indicators is available within the “Invite-only” section of TradingView’s Indicators menu.
View our Guide to learn more.

Trend Reversal Signals
Setups & Trends
E5 Trading’s Trend Reversal Signals and Candles are simply game-changing, and you’ll never want to trade without them. Designed to capture reversal price action, local tops and bottoms, and scam price action, our reversal signals are one of the most powerful and easy-to-use features available on the market. Learn the simple process to confirm reversal price action, and you will truly be trading with a market edge!
Trend Reversal Signals [R] identify a local trend's potential end and a new one's beginning. All reversal signals are deemed POTENTIAL reversals until the price action of the next one or two candles after the reversal signal confirms the reversal. Reversal signals may be confirmed manually using a simple method or confirmed automatically using the Trend Reversal Signals drop-down menu.
To manually confirm a potential bullish reversal, the close of the 1st or 2nd candle following the reversal candle must be greater than the high [wick] of the reversal candle. To manually confirm a potential bearish reversal, the close of the 1st or 2nd candle following the reversal candle must be less than the low [wick] of the reversal candle.
To use automated confirmation capabilities, select “Confirmed Reversal”. Any potential reversal signal [R] not confirmed by the first or second candle will remain on the chart, but faded out since it is not a confirmed reversal signal.
Click image to view in TradingView.

Trade Setups
Setups & Trends
Three robust trade setups [Transition, Momentum, and Phase Shift] are available on all timeframes to help you identify winning trade opportunities, time trade entries and exits, and crush the market. Play both sides of the market with real-time long | short signals that generate from each trade setup.
When you subscribe to the E5 Trading indicator suite, you will receive VIP access to the E5 Trading Discord where long | short signals from these three [3] trade setups stream in real-time into dedicated channels for each of five [5] popular timeframes, including the Daily, 4-hour, 1-hour, 15-minute, and 5-minute.
Serving as a market screener, our real-time streaming trade signals will help you cut through the noise and quickly identify high-probability trade opportunities. Currently, signals from these trade setups are available in our Discord for the top 25 cryptocurrencies by market cap.
Click image to view in TradingView.

Squeeze Visualization
Squeezes and Breakouts
Looking for a simple trading system and cheat code that you can reliably execute over and over and over again? This is it — E5 Trading squeeze plays! Squeeze visualization combined with Squeeze Early Entry and Squeeze Breakout signals change the game.
Squeezes occur when an asset's price volatility falls to statistically low levels. Breakouts from the squeeze are typically violent and potentially highly profitable if the trader can get in the trade early and catch the breakout in the right direction. [E5 Trading] Squeezes & Breakouts was built to help traders take advantage of these squeeze play opportunities.
[E5 Trading] Squeezes & Breakouts lets you know whenever price action is in a squeeze for any asset on any timeframe. Squeeze shading shows on the chart and real-time streaming squeeze signals are sent to the E5 Trading Discord for each of five [5] timeframes, including the Daily, 4-hour, 1-hour, 15-minute, and 5-minute.
The Squeeze table in the lower-right corner of the chart displays the real-time squeeze status on the current timeframe plus commonly used higher timeframes for each asset.
Click image to view in TradingView.

Squeeze Early Entry & Breakout Signals
Squeezes & Breakouts
Squeeze Early Entry and Squeeze Breakout signals can only occur once price action has started a squeeze. Pay attention to assets that are currently in a squeeze and be ready to take action because explosive price moves are coming soon!
Squeeze Early Entry signals [small triangles] offer a clue about the potential squeeze breakout direction and provide traders with an opportunity to start building a position while in a low-volatility squeeze and in anticipation of a violent breakout.
Squeeze Breakout signals [large triangles] flag when the price breaks out of a statistically low-volatility period. This is either the beginning of a potentially massive move or a nasty fake-out, which is why you MUST use a stop-loss on every trade.
Play the probabilities and cut losses quickly on the fake-outs. Preserve capital with good risk management, ride the winners, and slay the market!
Squeeze Early Entry and Squeeze Breakout real-time streaming trade signals are sent to the E5 Trading Discord for each of five [5] timeframes, including the Daily, 4-hour, 1-hour, 15-minute, and 5-minute.
Click image to view in TradingView.

Trade Setups: Squeeze Filter
Setups & Trends
The Squeeze Filter eliminates all trade setups inside a low-volatility squeeze where trade setup signals are typically less reliable and where the future trend can be more challenging to determine.
This feature helps you avoid potentially noisy signals, and instead focus on Squeeze Early Entry and Squeeze Breakout signals generated by the [E5 Trading] Squeezes and Breakouts indicator.
Disciplined traders who play squeeze breakout price action can perform exceptionally well with this strategy as long as good risk management is practiced [i.e., responsible position-sizing and use of a stop-loss on every trade].
Click image to view in TradingView.

Price Strength Signals
Setups & Trends
Price Strength signals were designed to flag the onset of potentially explosive price moves based on market conditions and price action.
Like Trade Setups, real-time Price Strength signals stream into E5 Trading Discord channels for each of five [5] popular timeframes, including the Daily, 4-hour, 1-hour, 15-minute, and 5-minute.
Click image to view in TradingView.

Real-Time Divergences Confluence
Setups & Trends
The most useful divergences tool on the market! Divergences occur when a technical indicator, like an oscillator, moves in the opposite direction of price. They often serve as an early warning of a trend reversal [via regular divergence signals] or trend continuation [via hidden divergence signals].
E5 Trading divergences flag in real-time directly on the price chart and provide a strength rating [1 to 6] based on the number of oscillators that simultaneously detect a divergence. Bullish divergences flag below price action, and bearish divergences flag above price action to help you detect potential trend reversals [regular divergences] or trend continuations [hidden divergences] before they happen.
Click image to view in TradingView.

Stop-Loss | Take-Profit Guardrails
Setups & Trends
Dynamic Stop-Loss | Take-Profit Guardrails are a must-have feature for traders of all experience levels, including algo-traders. This feature helps traders to effectively time trade entries/exits, automate the calculation of stop-loss | take-profit levels, and stay in trades while price action remains inside its calculated normal volatility range.
Due to its dynamic real-time update capability and utility as a trailing stop-loss | take-profit automation tool, this feature can be a powerful addition to both manual and algorithm [i.e., bot-based] trading systems.
A simple example trading technique using this feature is to go long when the guardrail transitions from being above price action [i.e., resistance] to below price action [i.e., support]. Vice versa for short trades.
Click image to view in TradingView.

Local Support | Resistance
Setups & Trends
Local Support and Resistance levels are calculated automatically based on price action and represent supply and demand zones to help you establish buy and sell targets, stop-loss, and take-profit levels.
Awareness of key support and resistance levels is critical for developing a trading plan, trading level-by-level, and avoiding unnecessary risk [e.g., longing into resistance or shorting into support].
Support and resistance levels are especially useful when combined with other indicator suite features to identify confluence.
Click image to view in TradingView.

Anchored Volume-Weighted Average Price
Setups & Trends
Anchored Volume-Weighted Average Price [AVWAP] is used to determine the fair market value of an asset. The volume-weighted average price is taken over a user-specified period, typically based on a high or low pivot or trading session start time, and the resulting AVWAP line then serves as a critical support | resistance level that price will eventually retest.
The AVWAP Support | Resistance Zone is a horizontal zone based on the latest calculated AVWAP price and can be plotted as another key level to watch alongside Local Support / Resistance. When price action is above the AVWAP, the horizontal AVWAP support | resistance zone acts as support with bullish zone coloring. When price action is below the AVWAP, the horizontal AVWAP support | resistance zone acts as resistance with bearish zone coloring.
Click image to view in TradingView.

RSI Moving Averages
Advanced RSI
The traditional relative strength index [RSI] momentum indicator measures the magnitude of price changes over a user-specified period to determine overbought and oversold conditions in the price of an asset.
[E5 Trading] Advanced RSI adds several sophisticated features to enhance the analysis of RSI to detect early signs of trend reversals and continuations. Combined with other E5 Trading indicators to identify confluence, the probability of entering winning trades is increased.
RSI moving averages help determine momentum shifts in the overall trend, similar to price moving average crossovers. When the fast-moving RSI crosses above the slow-moving RSI, bullish. When the fast-moving RSI crosses under the slow-moving RSI, bearish.
Click image to view in TradingView.

RSI Bollinger Bands
Advanced RSI
Like Bollinger Bands for price action, RSI Bollinger Bands can be used as moving oversold and overbought thresholds, which adjust with the RSI oscillator based on its volatility. When RSI breaks out below the lower RSI Bollinger Band, the asset is oversold on a relative basis. When RSI breaks out above the upper RSI Bollinger Band, the asset is overbought on a relative basis, given its price history.
Evaluating RSI on a relative basis is more reliable than evaluating RSI on an absolute basis with fixed 30/70 thresholds for oversold/overbought, which traditional RSI analysis relies on. This is because rigid 30/70 thresholds are arbitrary rules-of-thumb that may [or may not] be relevant to current market conditions.
When RSI is riding the upper or lower Bollinger Bands and breaks towards the middle, this reversion to the mean [i.e., basis line] can signal that the trend may be reversing. The basis line can also be used as a support line when RSI values are above it or as a resistance line when RSI values are below it.
Click image to view in TradingView.
Advanced Oversold | Overbought
Advanced RSI
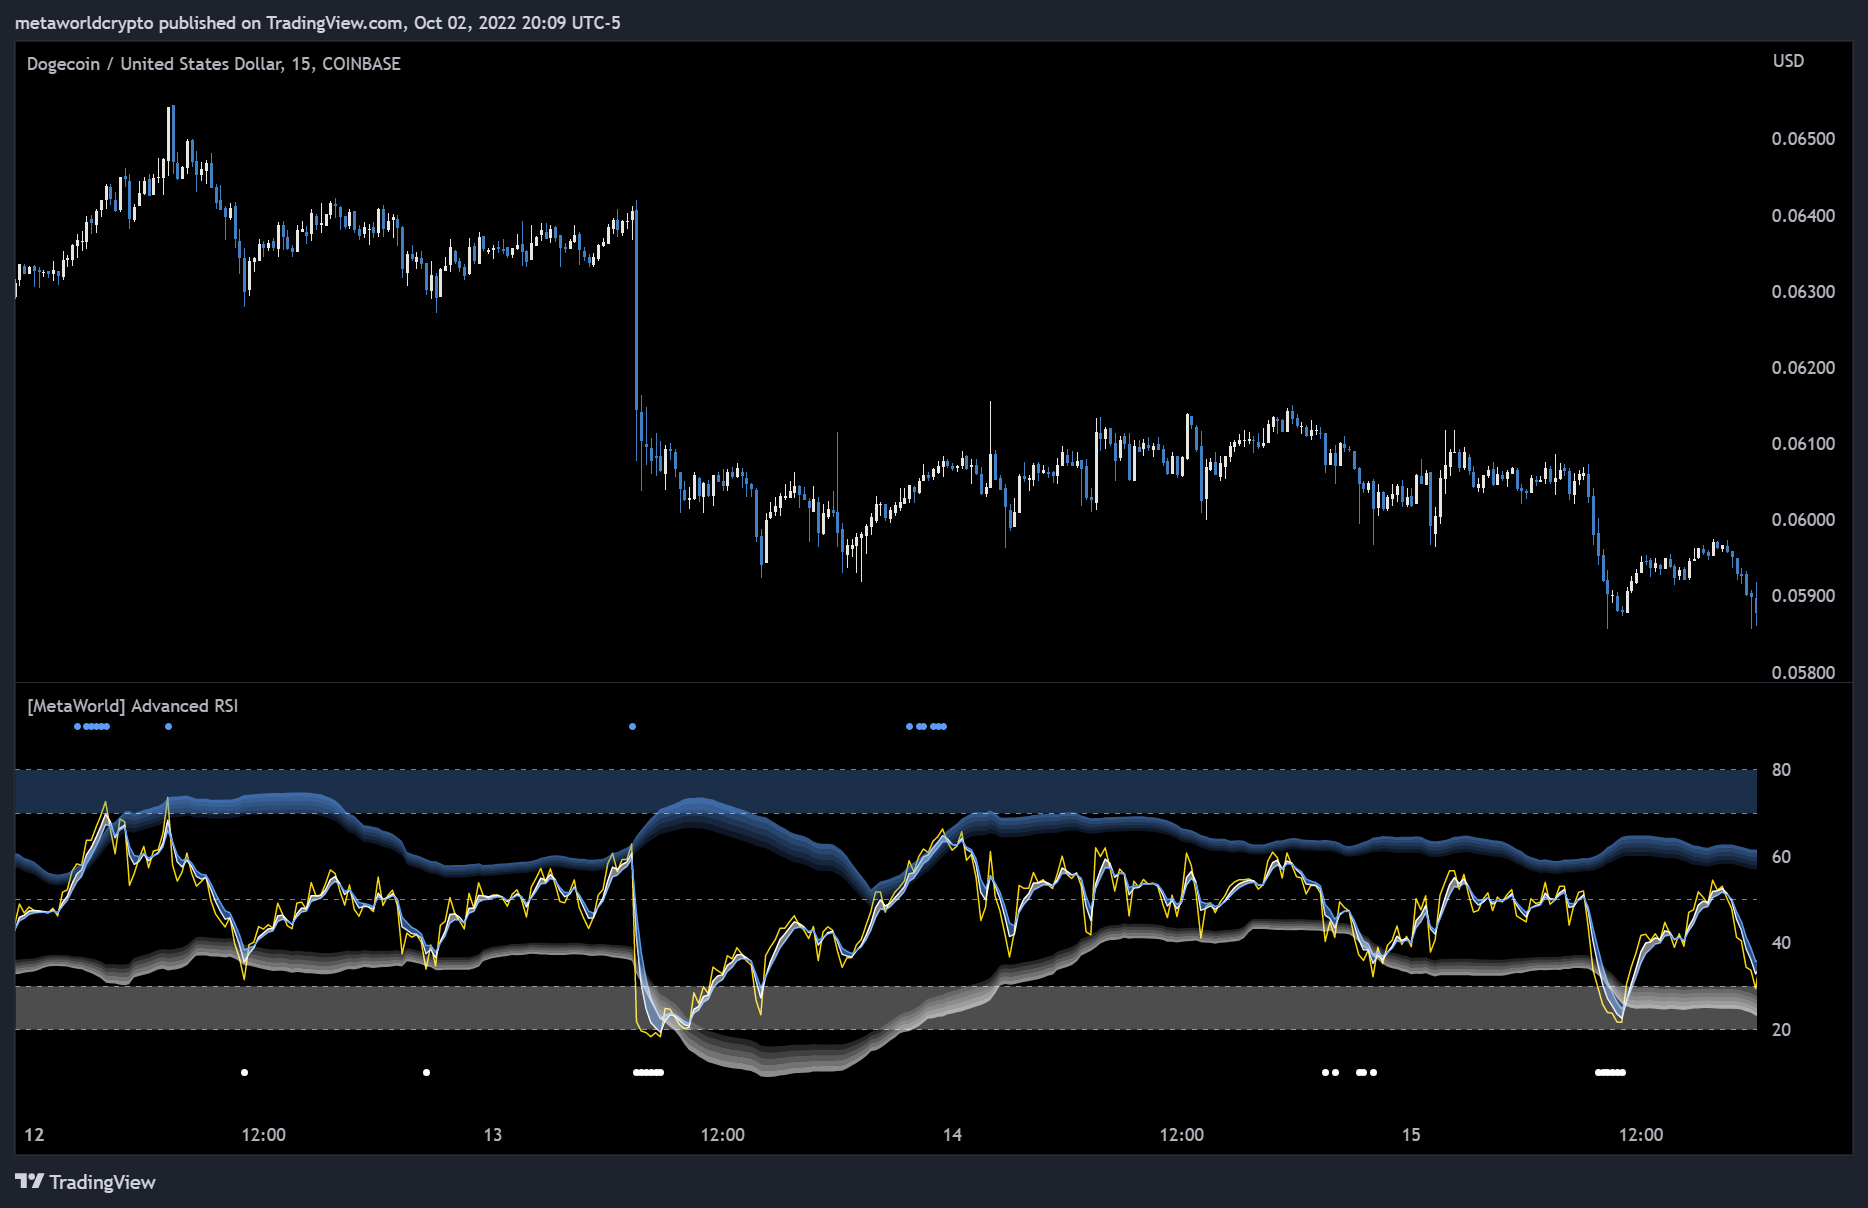
Advanced Oversold | Overbought signals [i.e., dots] provide the Advanced RSI trader with the means to identify trend reversal or continuation opportunities that most traders will miss.
Advanced Oversold | Overbought signals reflect an adaptive approach that normalizes RSI data relative to the trend using RSI Bollinger Bands. These signals improve the reliability of RSI oversold and overbought signals compared to traditional methods and eliminate the need to trade within the confines of fixed 30/70 RSI thresholds.
Signals may appear even when the standard RSI line may be far away from the generally accepted oversold and overbought thresholds [i.e., 30 and 70, respectively].
Click image to view in TradingView.

RSI Real-Time Potential Divergences
Advanced RSI
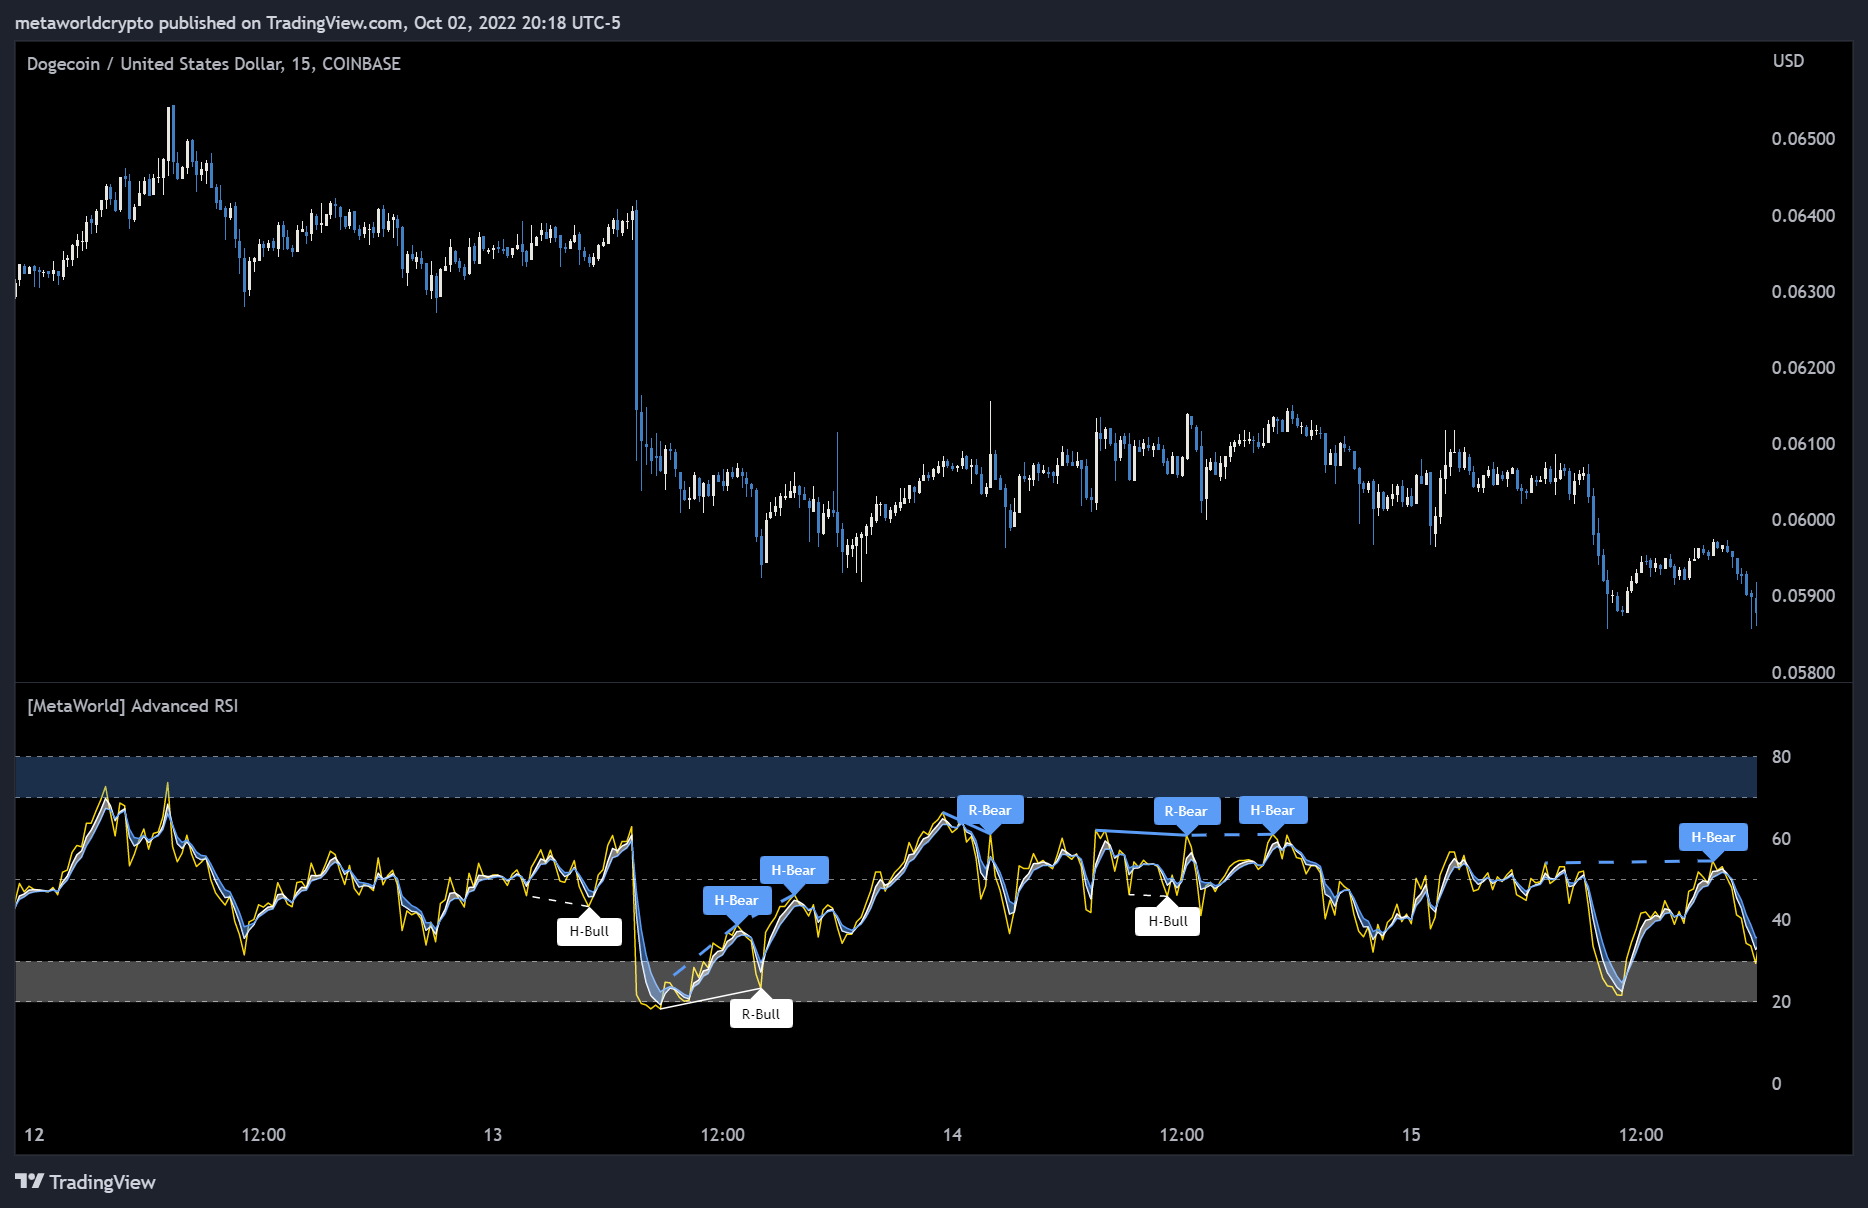
Regular and Hidden divergences flag in real-time when 'Potential' [default] is selected as the Divergences Confirmation State.
This feature is a leading indicator that provides the trader with an early warning of a potential trend change [regular divergences] or trend continuation [hidden divergences].
RSI regular divergence signals are plotted directly on the RSI chart, with bullish and bearish divergences flagging with an ‘R’ below and above the RSI line, respectively.
RSI hidden divergence signals are plotted directly on the RSI chart, with bullish and bearish divergences flagging with an ‘H’ below and above the RSI line, respectively.
Click image to view in TradingView.
RSI Confirmed Divergences
Advanced RSI
Divergences occur when a technical indicator, like an oscillator, moves in the opposite direction of the price. They often serve as an early warning of a trend reversal [via regular divergence signals] or trend continuation [via hidden divergence signals].
Regular divergences indicate potential trend reversals [i.e., trend weakening].
Hidden divergences indicate potential trend continuation [i.e., trend strength].
Click image to view in TradingView.

Relative Volume Thresholds
Relative Volume
Never look at volume the same way again! Finally, a useful yet simple, volume indicator.
Volume has been normalized to a percentage value which enables using standard thresholds across all assets to determine relative strong, average, and weak volume. Automatically calculated threshold levels help to determine relative volume strength.
Use as confluence with price breakouts...trends can often be identified early when price breakouts are supported by strong relative volume. Similarly, price breakouts supported by weak relative volume will likely reverse.
Click image to view in TradingView.

Volume Power Bars
Relative Volume
Bull | Bear Volume Power Bars show statistically significant Bull and Bear Volume Bars that may indicate whale [or institutional] buying and selling.
Trends often follow the direction of Volume Power Bars, so use them to follow the smart money!
Click image to view in TradingView.